The LEGO Principle
Node-RED lets you connect ready-made code building blocks to create event-driven applications with little or no code writing.
Imagine you come home and the blinds come down in the living room, subtle lighting turns on, Alexa says hello, and the coffee maker prepares a cup of coffee. You can arrange all this magic at the push of a button without staying up all night writing code thanks to the low-code Node-RED platform.
With Node-RED, a few elements control the flow. Each element represents a whole block of instructions that would require a large number of lines of code in conventional programming (Figure 1).
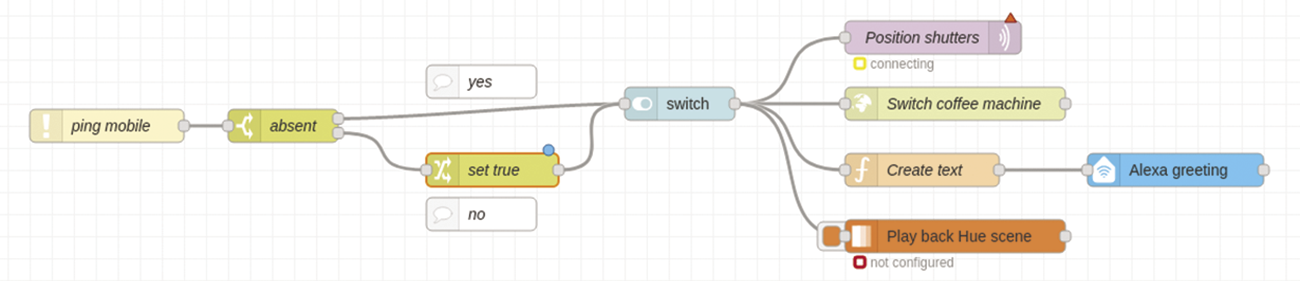
Every Node-RED flow follows the same programming principle. First, you need a trigger. In the example shown in Figure 1, the trigger evaluates a ping signal from a cell phone. You could also use geodata as the trigger by replacing the ping evaluation with a geofencing element. In either case, the event triggers the data processing, which includes queries and involves modeling data or, as an example, setting a dashboard display. All of this can be arranged visually, and it takes place – unlike many other home automation systems – in a unified user interface.
Open Source from the Start
Long considered an insider tip in the maker scene, Node-RED has become a popular and widely-used tool for writing simple programs and setting up complex applications, such as smart home systems, as well as a way to try something out to save time.
Still relatively young, Node-RED was developed in late 2013 by Nick O’Leary and Dave Conway-Jones, both scientists with the IBM Engineering Technologies Group, as an open source side project. The goal was to provide a simple way to quickly connect devices with web services and programming interfaces.
Node-RED is based on the Node.js programming language, which is why you find Node in the name. Dave Conway-Jones suggested the RED bit because it sounds like Code Red, an alarm code as well as a family of computer viruses. Node-RED has gained popularity in a short period of time and is now a widely used tool for the Internet of Things (IoT) and industrial application prototyping.
The Basic Principle
Node-RED is a platform with a steadily growing user base and an active developer community that continuously contributes new nodes. The range of applications for Node-RED is broad and still growing, with the ability to use social media channels (X, formerly known as Twitter; email) as well as databases (MariaDB or InfluxDB). In addition to simple tasks (ad-hoc evaluations, prototyping), Node-RED can also be used to solve complex problems in an elegant way. However, not all tasks are equally well suited for Node-RED. For example, Node-RED has difficulties with loops, and processing large tables is often better off left to traditional programming languages.
Basically, Node-RED provides predefined code blocks for executing tasks. These code blocks are referred to as nodes. Nodes can be connected and networked with each other. The data processing starts in the input nodes, which are followed by the processing nodes and the output nodes. The complete structure is known as the flow.
Flow-based programming is based on an idea by J. Paul Morrison. Back in the early 1970s, Morrison considered an application to be more than just a single, sequential process with a start, a multitude of processing steps, and an end after processing the tasks. Instead, he was interested in a network of asynchronous processes that communicate via streams of structured data blocks (information packets).
Installation
You can host Node-RED on any operating system or even in the cloud. In my examples in this article, I use a Raspberry Pi, which is popular due to its frugal energy requirements. To get started, open a terminal and update the system with
sudo apt-get updateOn the Raspberry Pi, Node-RED provides a script for installation and updates, which you start with the code in Listing 1.
Listing 1: Starting the Script
bash <(curl ‑sL https://raw.githubusercontent.com/node‑red/linux‑installers/master/deb/update‑nodejs‑and‑nodered)The script installs Node.js, npm, and Node-RED. It works on all Debian-based Linux systems, such as Ubuntu. However, you may find the current Node-RED v3.0.2 requires a newer Node.js than found in the latest Ubuntu LTS v22.04. In this case, you have several options: You can install a recent Node.js from the source code, download the installer script and tell it to install an older Node-RED when called, install the Snap version, or switch to Docker. Regardless, make sure that all the required packages are in place with
sudo apt install build-essential git curl
After the install, you can typically launch Node-RED either at the terminal with
node-red-start
or as a system process at boot time with
sudo systemctl enable nodered.service
Essential Files
All of the important Node-RED files reside in ~/.node-red, a hidden folder in your home directory. The most important files are in the node_modules folder, which contains the installed nodes, and the flows.json file, which contains all the flows in JSON format. Backing up flows.json saves all of your flows. The settings.js file defines the Node-RED configuration and is where you set up important things, such as the password security level and encrypted connection features (HTTPS). The length of the debug output (1,000 characters by default) or the logging level can also be defined in settings.js.
Node-RED Editor
The Node-RED editor is the core element for development with Node-RED. Its strengths lie in visual programming, a powerful debugger, and a linter (a tool for checking the code for problems). In addition, some system administration functions can be called in the editor. The Node-RED developers have implemented many new features in recent years, making programming with Node-RED even more intuitive.
The Node-RED editor runs in a browser. In a local installation, the Node-RED server listens on port 1880 by default. In a browser running on the same host as the Node-RED server (such as Chromium on the Raspberry Pi), the URL is http://localhost:1880/. Be careful: The Node-RED installation process leaves you with an unprotected system! Securing access with a username and password is highly recommended. A secure HTTPS connection is also essential if you want to support access from outside the local network.
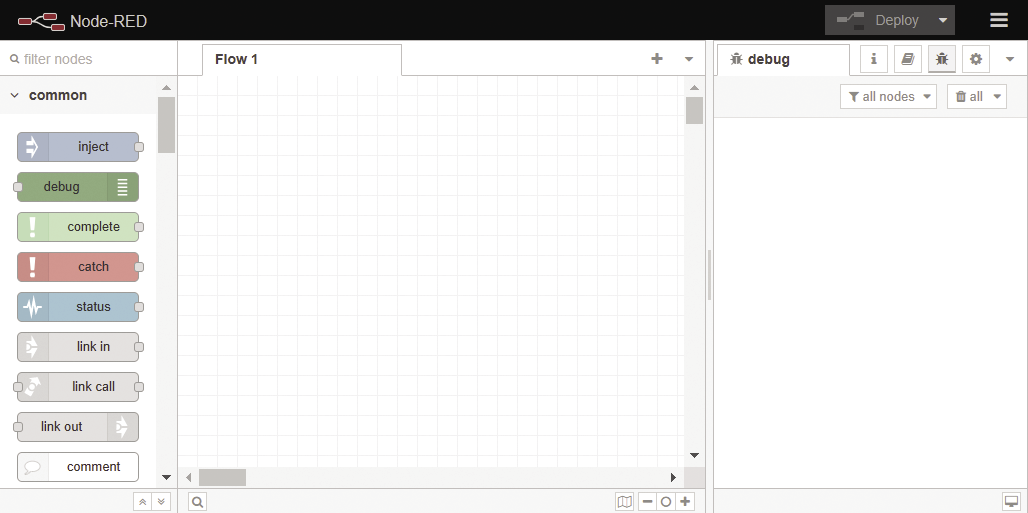
The Node-RED editor’s browser window (Figure 2) is divided into four sections:
- The header (at the top) contains the Deploy button for activating flows and a menu icon. From the menu icon, you can access various system settings, as well as some helpful functions that go beyond plain-vanilla editing (e.g., importing or exporting flows).
- The node palette (on the left) contains the deployable nodes. The nodes are arranged by topic, with the ability to expand or collapse individual topics.
- The workspace (in the middle) is where flow development takes place. It contains a management bar for the flows, the flow design area, and a footer.
- The sidebar (on the right) provides useful information (e.g., help, debug) and management options (e.g., configuration nodes, which are nodes for settings such as an email account’s user data). The nodes in the sidebar are divided into categories and can be opened by pressing buttons.
Message Strategy
Following in the tradition of using a Hello World program to explain data structures, language elements, and relationships in a given program language, my first Node-RED example uses a Hello World flow consisting of an Inject node that executes a program flow and a Debug node that displays the results (Figure 3).
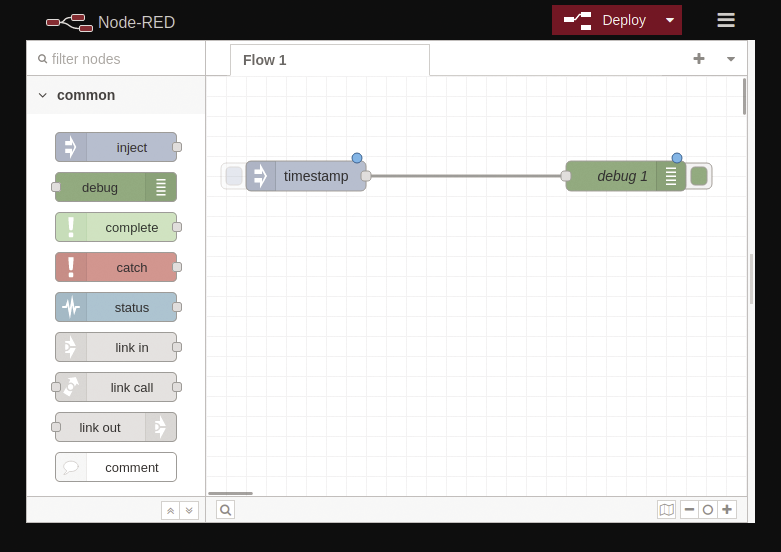
Flows can be created by dragging nodes from the node palette into the workspace’s flow design area. Each node has at least one input or output port, symbolized by the small gray squares. Some nodes also have multiple output ports (e.g., one port for normal data output and another for error messages), but a node can have only one input port. Individual nodes are connected by wires, which you create by dragging a connection from port to port while holding down the left mouse button.
Above the nodes, symbols provide information about the processing status. A blue dot indicates that changes have not yet been applied, while a red triangle indicates that configurations still need to be made. Information can also appear below the node in the node decoration (e.g., a Switch node’s status). In most cases, you will need to modify the nodes you use. To do this, double-click on the node to modify the node properties (Figure 4).
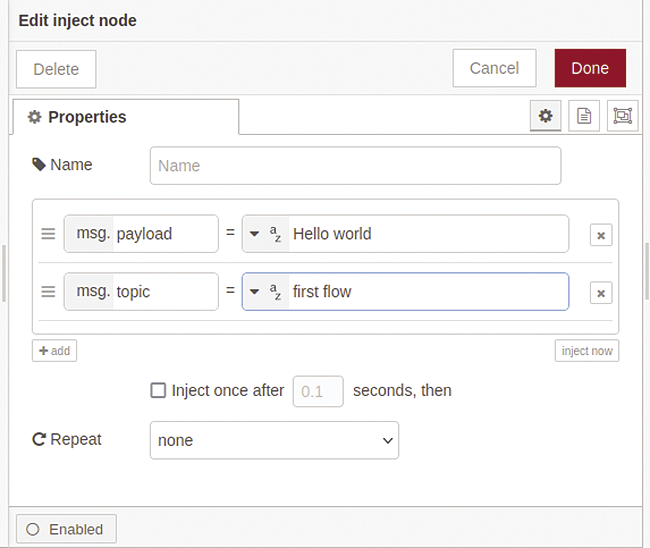
The Properties dialog is roughly the same for all nodes; the difference is in the specific properties, which can be extensive in some cases. In my example, I want the Inject node to inject a message where msg.payload equals “Hello World” and msg.topic equals first flow. After accepting the changes (using the Deploy button in the header), clicking on the larger gray square to the left of the Inject node starts the flow. It sends a message to the Debug node. The debug output in Figure 5 shows the entire message object.
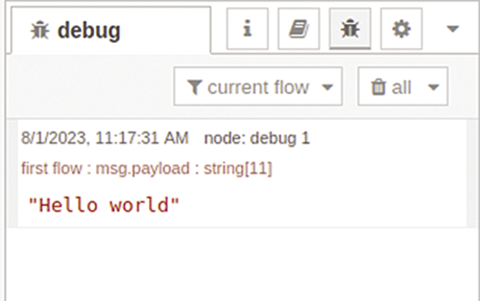
You can clearly see the message format: a JSON object. JSON in particular meets modern requirements for object-oriented programming with regard to the exchange of data between one or more systems. Pushbullet, Telegram, the Hue lighting system, and many other programs use JSON. It builds on a structure with a name-value pair ("topic": "first flow") and on an ordered list (table) of values ("colors": ["blue", "red", "yellow"]).
Each message consists of at least one message ID (_msgid) and the message body (payload). The message ID remains the same throughout the entire message processing process, even if the message flow branches. The message body contains the message text in JSON format. Deep nesting is not uncommon. The debug output helps to keep track of the object by collapsing or expanding the object’s individual components. Besides this, objects such as "topic" can be added to the first object level of the message – the level then depends on the circumstances.
You’ll also find the JSON format in the settings.js configuration file and as a format for storing flows, as shown in Listing 2 in the Hello World flow.
Listing 2: Flow Saved in JSON Format
[
  {
    "id": "b4d449fdd05e5ebd",
    "type": "tab",
    "label": "Flow 1",
    "disabled": false,
    "info": "",
    "env": []
  },
  {
    "id": "4ef230ee3cdeb12d",
    "type": "inject",
    "z": "b4d449fdd05e5ebd",
    "name": "Hello World",
    "props": [
      {
        "p": "payload"
      },
      {
        "p": "topic",
        "vt": "str"
      }
    ],
    "repeat": "",
    "crontab": "",
    "once": false,
    "onceDelay": 0.1,
    "topic": "first flow",
    "payload": "Hello World",
    "payloadType": "str",
    "x": 100,
    "y": 40,
    "wires": [
      [
        "1aba6a2edc504015"
      ]
    ]
  },
  {
    "id": "1aba6a2edc504015",
    "type": "debug",
    "z": "b4d449fdd05e5ebd",
    "name": "debug 1",
    "active": true,
    "tosidebar": true,
    "console": false,
    "tostatus": false,
    "complete": "true",
    "targetType": "full",
    "statusVal": "",
    "statusType": "auto",
    "x": 300,
    "y": 40,
    "wires": []
  }
]
Processing Data
My next not-too-complex example demonstrates how easily and powerfully Node-RED supports programming. This example feeds data from a soil moisture sensor via USB to Node-RED. Of course, you can change the trigger element to suit your needs. In other use cases, the trigger could just as easily be incoming mail, Telegram messages, or TCP requests. The same applies to the results of data processing (debug output, monitoring on a dashboard, or storing data in a file or database). The principle is always the same.
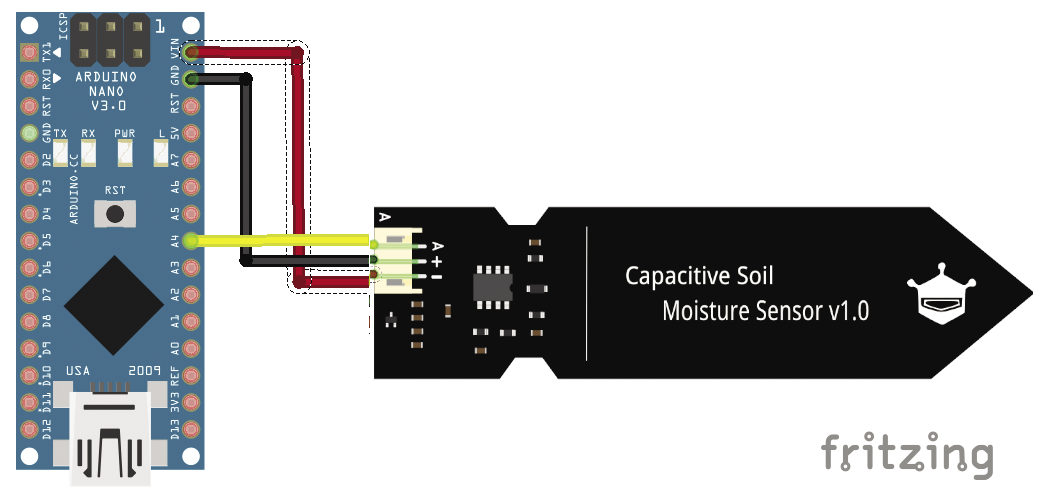
As the first step, I need to measure soil moisture with a capacitive soil moisture sensor (Figure 6). An Arduino Nano converts the analog measured value (voltage) into a numerical value and outputs the value via the serial interface every 10 seconds. The Arduino code only consists of a few lines (Listing 3).
Listing 3: Arduino Code
void setup() {
Serial.begin(9600);
}
void loop() {
Serial.println (map(analogRead(4), 0, 1023, 0, 100));
delay(5000);
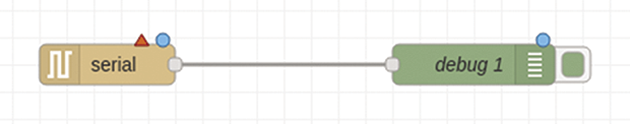
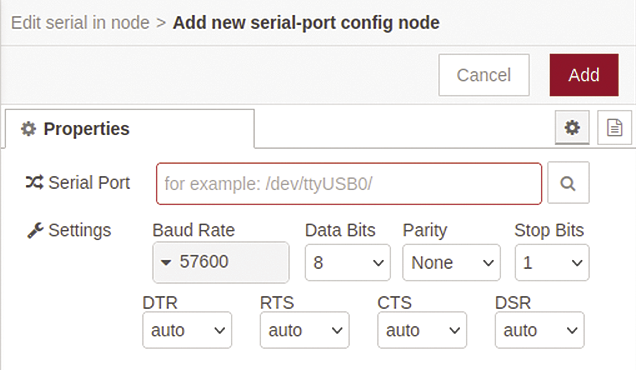
}Node-RED has a special node for receiving data from a local serial port: the Serial-In node from the Network section of the node palette. It replaces the Inject node from the Hello World example. The red triangle above the Serial-In node (Figure 7) indicates that general configuration settings need to be made in addition to configuring the node properties. Double-click to open the node properties window. You need to specify the port for the serial interface. The magnifying glass symbol (located at the bottom of the workspace) makes it easier for Node-RED to find available ports and to specify syntactically correct parameters. You can select the correct baud rate (9600 in my example) from a drop-down list (Figure 8).
After the flow has been accepted, the received values can be taken from the debug output. The entire message object has three name-value pairs: payload, port, and _msgid. The content of payload includes the carriage return line feed character (\n) in addition to the numeric value; it is used to split up the data stream received via the serial interface. Other splitting options are by fixed length or after a time interval.
Dashboard
Because visualizing the measured values in a Debug node is not very user friendly for long-term operation, Node-RED offers graphical user interface (GUI) packages. A search for “Dashboard” in the Palette Manager (Main Menu | Manage Palette | Installation) yields more than 40 hits. While no package can currently compete with Grafana, these GUIs offer sufficient performance for most use cases. For instance, the uibuilder package gives users the ability to create web interfaces dynamically. For this example, I will be using the node-red-dashboard package, which includes nodes for typical use cases and is the most widespread, solid, and mature package.
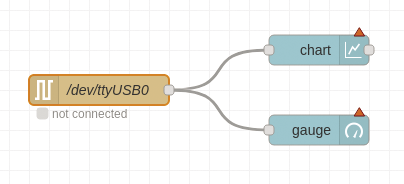
You can use node-red-dashboard to create a very versatile dashboard. It can have multiple tabs to organize information by topic. A tab holds one or more vertical columns (groups) that, in turn, store the widgets. The default column width is six squares, and the default size of a square is 48x48 pixels. All this can be changed, as can the dashboard theme. Applying this to the soil moisture sensor example, the measured data can be visualized in the form of a line diagram or a pointer gauge like a speedometer. Nodes for this then replace the Debug node (Figure 9).
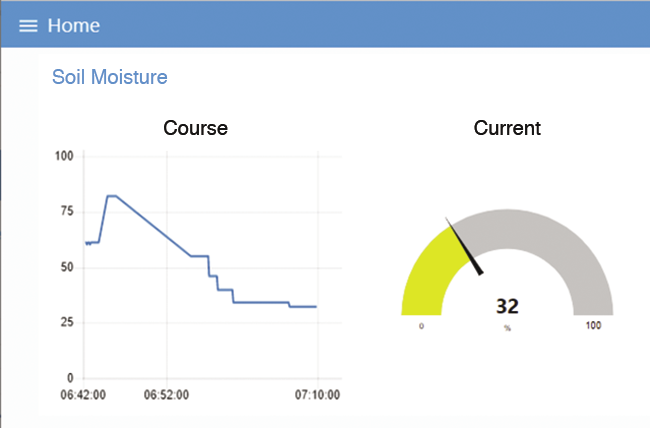
The red triangles again indicate that some configuration work is required (assigning the widget to a tab or group that may still need to be created), and you need to define the node properties again. Figure 10 shows how the incoming measured values are displayed without making use of the extensive configuration options of the Chart or Gauge nodes.
Creating Flows
Node-RED can help you design program-controlled processes. Usually, programming means writing smaller or larger amounts of code, which often becomes unmanageable unless you exercise self-discipline. Depending on the choice of language, in-depth programming knowledge is required. If you want to test the code, you have to repeatedly compile and bind it to create an executable module; this can require constant switching between different windows (editor, terminal). Node-RED simplifies this procedure.
As another example of Node-RED’s capabilities, I will activate an irrigation system via a switch (a Shelly relay in my example) if the soil is too dry. This results in different blocks in the program flow:
- Receiving the measured values
- Querying for a threshold value that is used to decide whether the soil is too dry
- Triggering the irrigation (switching on)
- Switching off the irrigation after a certain time
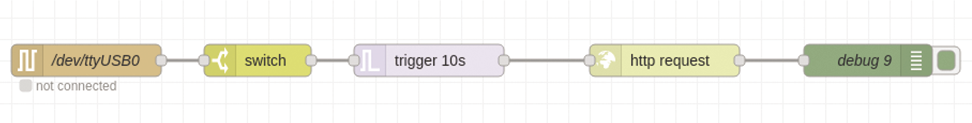
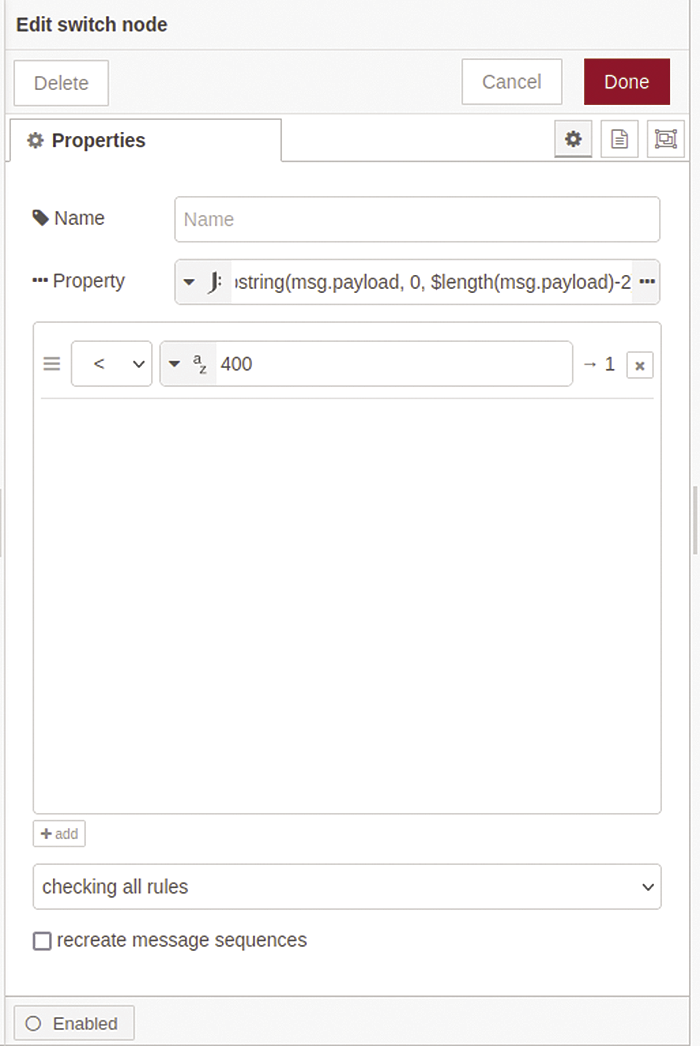
Basically, Node-RED solves this problem with just four nodes. The final Debug node is for control purposes only and has nothing to do with the core task (Figure 11). The measured values are transferred to the system in the usual way via the USB interface. A Switch node checks whether a defined threshold value (an arbitrary value of 400 in my example) is exceeded. In other words, it acts like an if query.
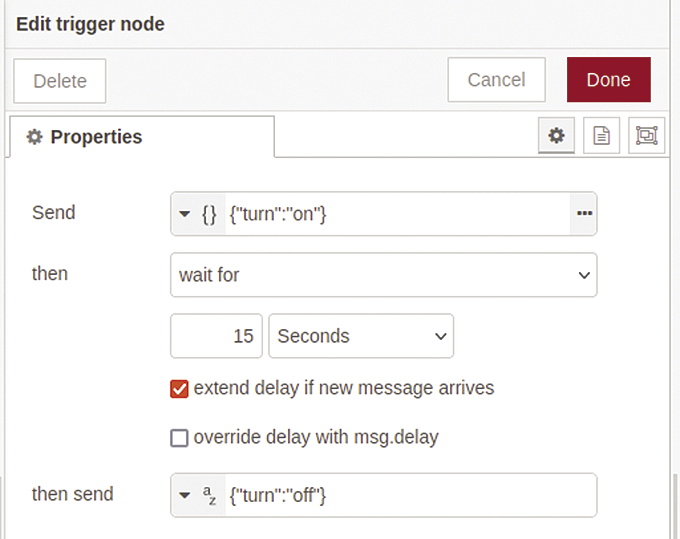
In most cases, the query references a message object that returns a number or a string as a comparison value. This does not work in this example because msg.payload contains the CR-LF characters in addition to the measured value. This is an essential requirement if you want to identify the transmitted data packets individually. Thus, the object to be compared needs to be modified using a JSONata expression (Figure 12), which is a lightweight query and transformation language for JSON data that can be used to apply simple functions directly to values. The $substring function is used to extract all the digits from msg.payload starting at the first position. The number of digits is the length of msg.payload minus the two characters for CR and LF. The Trigger node handles switching on and switching off the irrigation system.
substr function.When a (below threshold) message is received, the node sends a JSON message to turn on the irrigation system. It then waits 15 seconds (i.e., slightly longer than the time at which the next measured value arrives) and then sends the switch-off message. The highlight is that the output of the Off command is held back if further messages arrive. Irrigation then continues until the soil has a sufficient moisture content (Figure 13).
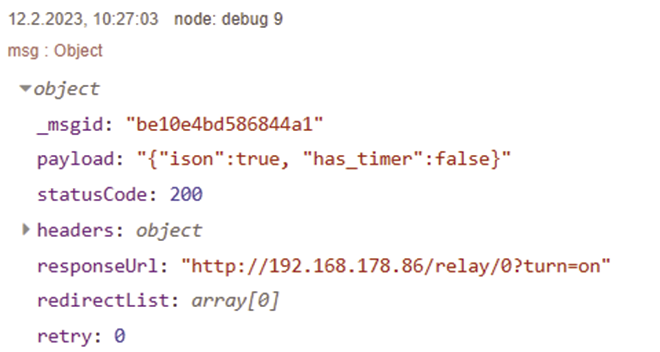
Shelly devices can easily be controlled using HTTP commands. This task is handled by an HTTP Request node at this point. The HTTP Request node’s GET method references the URL by which the Shelly device is accessible on the local network. The action results from the msg.payload object. The HTTP Request node converts this object and adds the result to the URL as a query string parameter. Figure 14 shows the debug output after a power-on operation. All in all, the task can be solved quickly and compactly with Node-RED.
Programming Functions
Node-RED has a wide range of versatile nodes that cover most requirements. However, situations can arise where the default nodes are not up to the task. The Function node is often the method of choice in this case. The Function node uses JavaScript to process messages. JavaScript is a powerful programming language and can delve deeply into the system. For this reason, Node-RED needs to be secured, especially if you allow access from outside your local network.
The Function node’s role as an all-rounder is already clear from its node properties. There is a separate option for:
- setting the number of output ports in the
SETUP; - programming the code that will be executed when the node is deployed in
START; - saving the code for each message input in
FUNCTION; and - storing the code that will be executed when Node-RED stops, or before the node is deployed again, in
STOP.
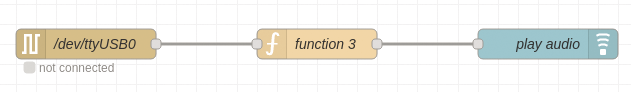
To demonstrate this principle, my example uses voice output (Figure 15) to inform the user of the soil moisture status once a minute. The Function node prepares the announcement. Listing 4 shows the code to be stored in the Function node for this task.
Listing 4: Controlling Voice Output
let value = msg.payload
let now = new Date();
let sek = now.getSeconds();
msg.payload = 'The soil moisture has a value of ' + value
if (value < '400') {
  msg.payload = msg.payload + "  Irrigation urgently required";
} else {
  msg.payload = msg.payload + " Everything is fine";
}
if (sec < 10) {
  return msg;
}
The variable value stores the content of msg.payload (i.e., the measured value). Then msg.payload is rebuilt. The contents depend on the measured value (set arbitrarily here). The variable sec contains the seconds part of the current time. Because a new value only arrives once every 10 seconds, the action of forwarding the newly created message is based on a time period and not on an exact value in seconds. The Play Audio node, which is also available for the dashboard, completes the flow with a voice output. It actually expects msg.payload to contain a buffer with a WAV file. If the browser provides native support for text-to-speech, msg.payload can (like in my example) also contain a string that is read aloud. You can choose from various female and male voices.
Conclusions
Node-RED is far from being just a click-and-enjoy tool. Instead, it can provide elegant solutions to complex and multi-layered tasks even in the industrial sector. It impresses with its variety of available building blocks (nodes), the clear (visual) representation of the program flow, and the intuitive user interface. The dashboard option is also of great value.