
Cold Snap!
Snap4Arduino brings the power of low-code programming to the Arduino hardware environment.
Scratch, from MIT, is a graphical coding environment that was originally designed for young programmers. Scratch is bundled with many Raspberry Pi releases, and it lets you create digital stories, games, and animations that communicate with the Pi’s General Purpose Input/Output (GPIO) pins. There also some options for using Scratch with Arduino modules, however most of these implementations are somewhat limiting.
Snap!, which was created at the University of California, Berkeley, is an extended implementation of Scratch. The major difference between Snap! and Scratch is that Snap! has a rich set of technical libraries. Some of these Snap! libraries include database and SQL interfaces, graphical trends, matrix manipulation, MQTT (standard messaging protocol for IoT), and Neural Net modeling. These additional libraries and other advanced features mean that Snap! is not just a teaching tool but is also ready to serve as a low-code alternative for IoT solutions.
The graphical low-code model is often useful in IoT environments, where less-experienced programmers are sometimes forced to adapt to the ideosyncracies of unfamiliar hardware. The Snap4Arduino version of Snap! offers a unique set of libraries that will upload and configure Arduino modules without the user needing any Arduino knowledge or software.
You can run Snap4Arduino either from a web page or as a standalone Linux, macOS, or Windows app. In this article, I will show you three projects that will help you get started with Snap4Arduino. The first project allows the user to adjust the colors on a Neopixel array. The second project creates a dynamic bar chart that shows temperature and humidity values from a DHT11 sensor. The final project uses the SciSnap! library to show sensor data in a realtime line plot and then save the results to a CSV file.
Getting Started
The USB/serial communications between Snap4Arduino and the microcontroller module is via the Firmata protocol. Firmata is a protocol designed to support communication between a microcontroller and a computer system. At project design time, the user can select which type of Firmata configuration they would like to install on their Arduino module.
The Snap4Arduino project offers an online web interface. To get full functionality, you’ll need to install a Chrome/Chromium plugin.
Desktop versions for 32- and 64-bit GNU/Linux systems are also available. It’s important to note that there may be some compatibility issues when switching between the desktop and the web versions, so it’s best to stick to one version.
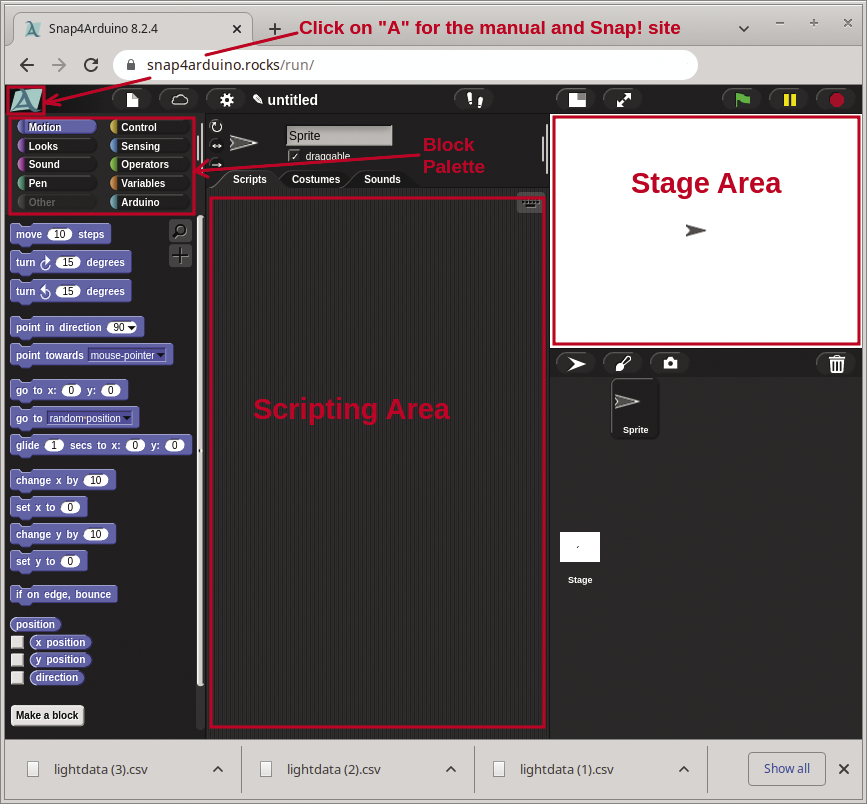
After you launch the Snap4Arduino web page or desktop application, you can reach the reference manual by clicking on the top-left A icon (Figure 1). The Snap4Arduino interface has three main areas. The left pane contains a palette area of blocks. These blocks are grouped and color-coded together based on their function. The center pane is the scripting area, and that is where the logic is created by dragging and dropping blocks together in a downward flowing pattern. The top-right pane is the stage area, which shows the visual output when a script is run.
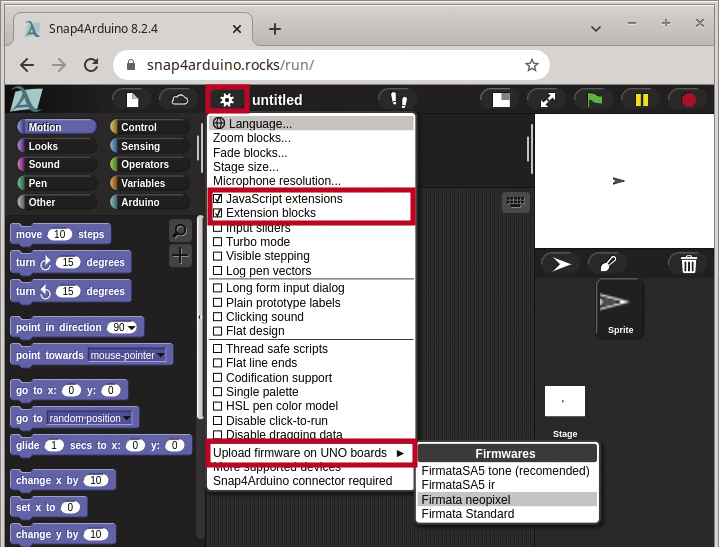
The first step in any project is to load the required Firmata configuration onto an Arduino module (Figure 2). The Snap4Arduino interface supports Arduino UNO and Mega-compatible modules for uploads. While you’re loading the Firmata configuration, you’ll also need to enable JavaScript extensions and Extension blocks in the settings drop-down menu.(Note: other modules such as: Nano, Leonardo, Micro, Due, NodeMCU, etc., are supported, but you’ll need to install Firmata manually through the Arduino IDE.)
To prove that the communications are working, you can create a test script to blink the module’s onboard LED (pin 13). Figure 3 shows a blink example. The script uses four Control blocks (in orange), and three Arduino blocks (in light blue). Communications are enabled by clicking on the Connect Arduino button and then by selecting a port. (For most Linux systems the port will be /dev/ttyACM0.)
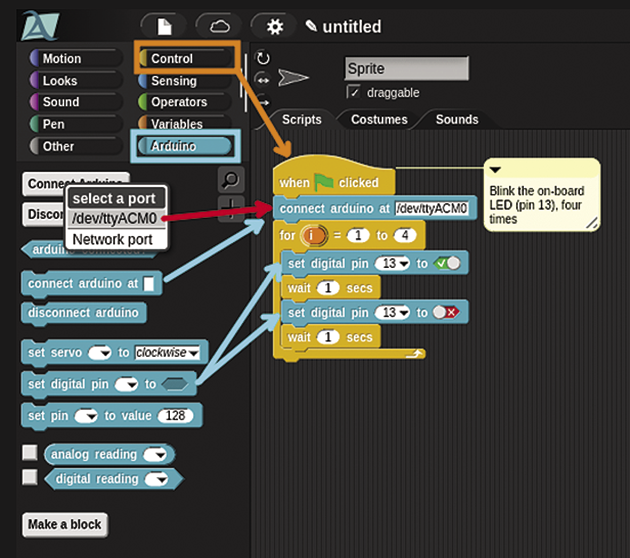
This test script uses a for block to cycle four times with a set digital pin to toggle pin 13 on and off. Time delays are enabled with wait blocks.
The Neopixel Project
Neopixels are individually addressable RGB color pixel arrays that come in strips, rings, and rectangular grids. From the previous test script, the Arduino module has already been loaded with the Neopixel firmata firmware. The next step is to import the Neopixel library into the Snap4Arduino project (Figure 4).
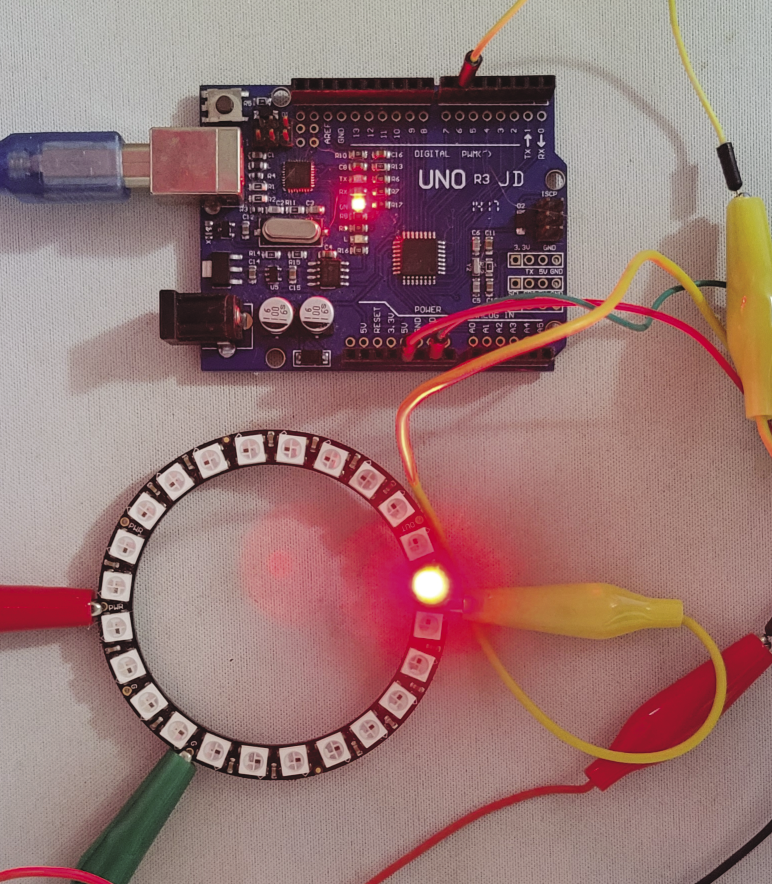
For this project, I used a 24-LED Neopixel ring (Figure 5), however, you could use any Neopixel array type. The alligator clips were used to connect the 5V, GND, and data pins (pin 6). My goal for this project was to allow the user to adjust the background color of the LEDs while a red LED circles around the ring. The script logic (Figure 6) starts by setting the Arduino connect port and defining 24 Neopixel LEDs on data pin 6. Four variables are defined: pin, Red, Green, and Blue. On the right stage pane, the color variables are defined with user-adjustable sliders.
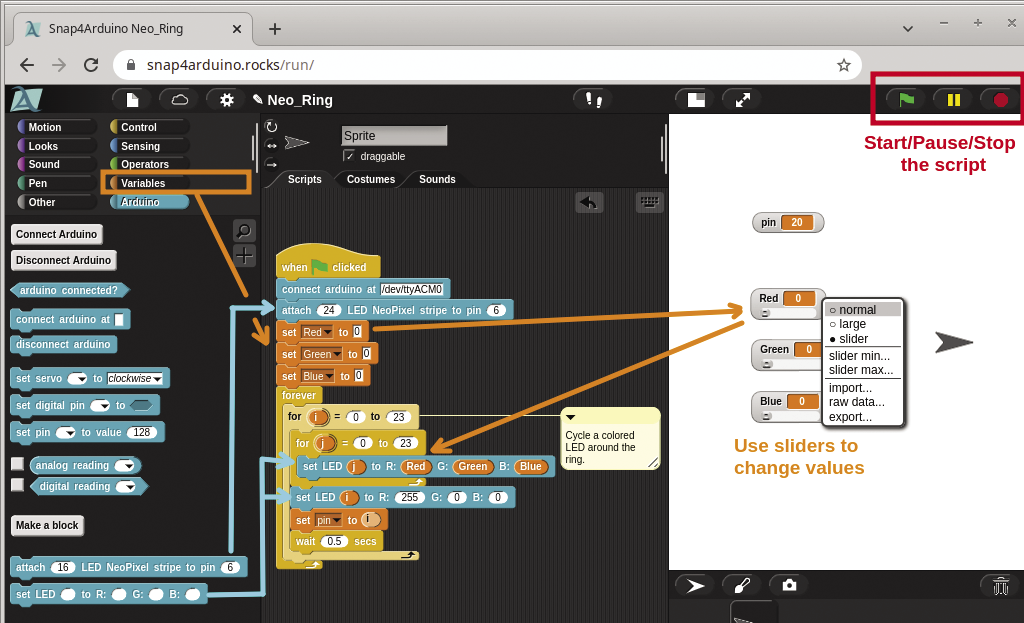
Two for loops are embedded within a forever loop. The inner for sets all the LEDs to the values from the color variable (Red, Green, and Blue) sliders. The outer for loop moves the red LED around the circle every 0.5 seconds. When the script is running, the pin variable will show the position of the red circling LED.
On the top right of the Snap4Arduino screen are three icons to start (green flag), pause, and stop the script from running. You can also start scripts by clicking on the top of the logic when green flag clicked block.
DHT11 Temperature and Humidity Sensor Project
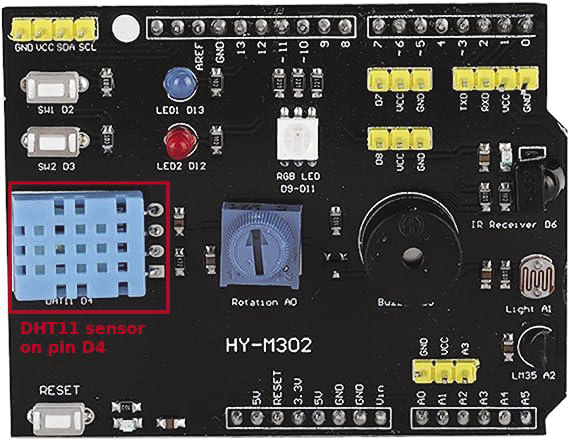
A DHT11 Sensor can be connected via expansion boards or by manually wiring the sensor to Arduino pins. Note, the Firmata firmware sets the DHT11 data pin on pin 4.
For my testing I used a TdR-STEAM-compatible board (Figure 7). These expansion boards are relatively inexpensive (~$12) and they offer two color LEDs, a Neopixel LED, a buzzer, a light sensor, a DHT11 sensor, and two input buttons.
This project uses a different Firmata configuration, so the Arduino firmware needs to be re-uploaded with the (recommended) FirmataSA5 tone firmware.
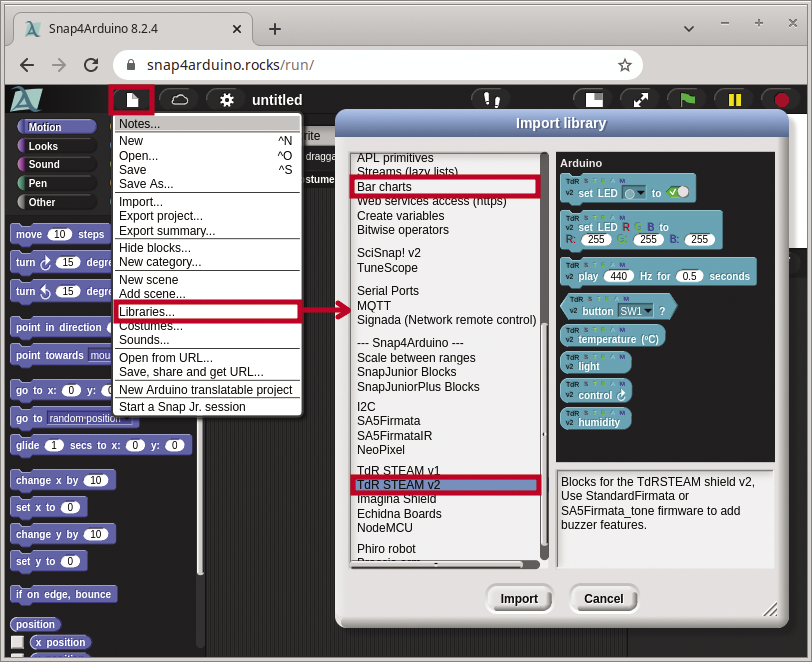
Next, Snap4Arduino requires you to import two libraries (Figure 8), the Bar charts and TdR STEAM v2 libraries. The Bar charts library expects the data to be in a table or a CSV file. Tables can be created in Snap! by making a variable a list of lists.
A Readings variable can be made into a 2x2 table by using three list blocks and a set block (Figure 9). The plot bar chart block (which is found in the Pen section) is passed the Readings variable, along with x-y coordinates, width, and height values.
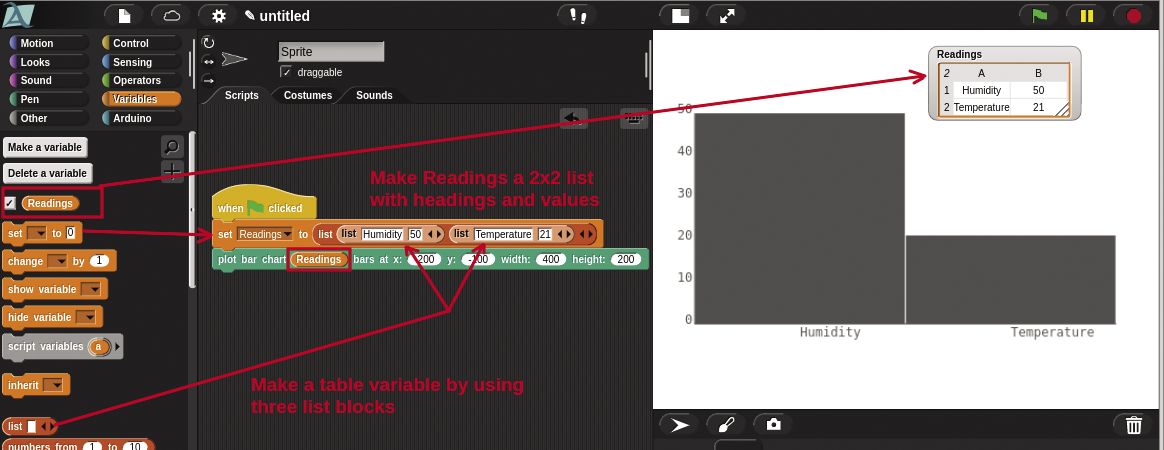
When these three blocks are run, the stage will show the Readings variable updated with the table information and a gray, static bar chart will appear. The final step is to make the bar chart dynamic with DHT11 sensor data. For this I create two additional variables, humidity and tempC, and I position the variables around the bar plot stage (Figure 10).
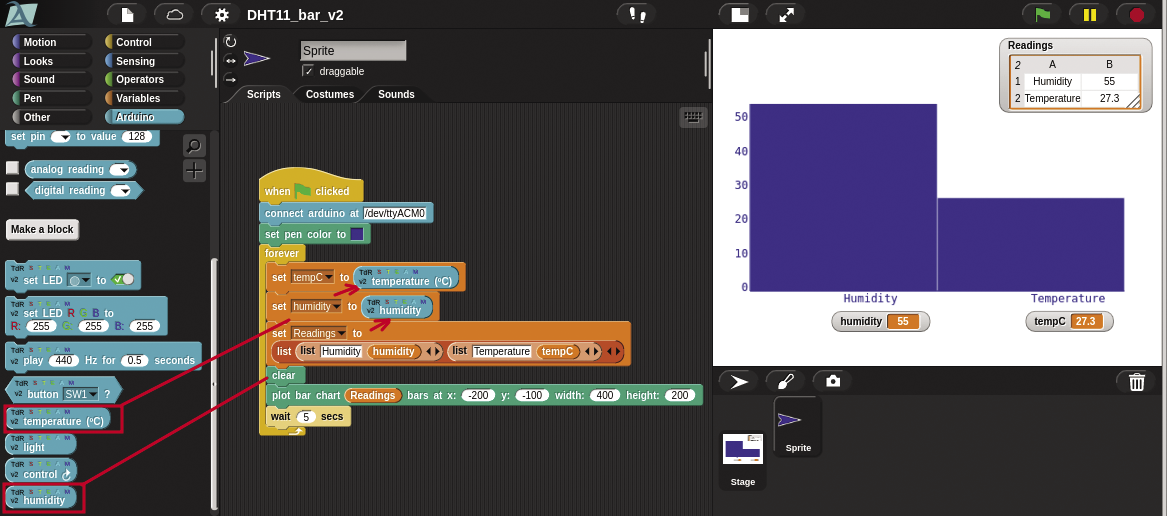
The two new variables are updated with sensor data by using set blocks to read TdR temperature and TdR humidity blocks. The chart color is defined by the set pen color block. Before a new bar chart can be drawn, a clear block is required.
When the final script is run, the bar chart and variables are refreshed with new sensor data every five seconds. Some good future features could include adding a time value to the chart or a toggle between degrees C and F.
In the next project, I’ll look at how to save sensor data to a CSV file.
The SciSnap! Library
Before getting started on the final project, it is worthwhile to get some background on the SciSnap! library. This package is imported like the other libraries, and it offers a huge variety of extra blocks that are grouped together in nine additional categories.
Figure 11 shows the power of the SciSnap library. This example lets the user select a CSV file from their local system. The data is then displayed in a table, with the maximum value in column 2 shown as a separate variable. The entire script to do this only takes four blocks!
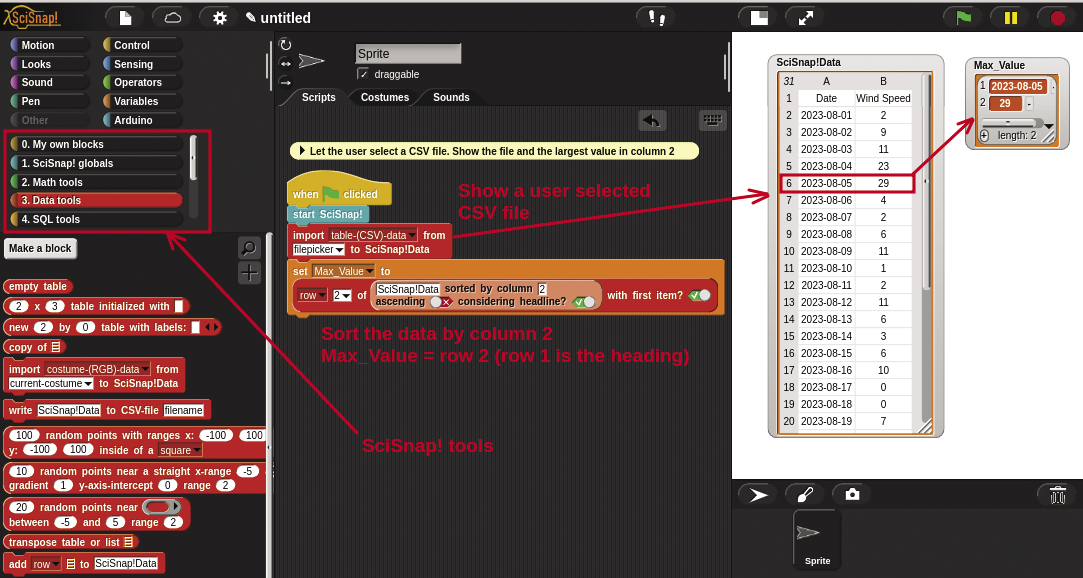
When using this library in a project, you’ll need to call a start SciSnap block before you can use any of its library blocks. This example uses the Data tools grouping. An import block is configured to use the filepicker option to select a CSV file and insert the data into the predefined SciSnap!Data variable.
To show the maximum data value, a sort is embedded within a select row block, and the result is set in the Max_Value variable. (Note: Row 1 has the headings, so row 2 has the maximum value.)
The SciSnap! library supports a large number of advanced features such as image manipulation, SQL tools, table and vector management, and neural networks. In the final project I’ll use SciSnap! to show dynamic updates on a line plot.
Real-Time Plots Project
You can use any sensor input for the final project. I used the TdR light sensor, with a flash light to generate some peak values. To get started, the first step is to import the SciSnap! and TdR STEAM libraries into Snap4Arduino.
Figure 12 shows the full script and results for a line plot with 60 light sensor data points. The script logic starts with a connect arduino and a start SciSnap block. The add row block builds a two-column table of the sample number and the sensor readings in the SciSnap!Data variable.
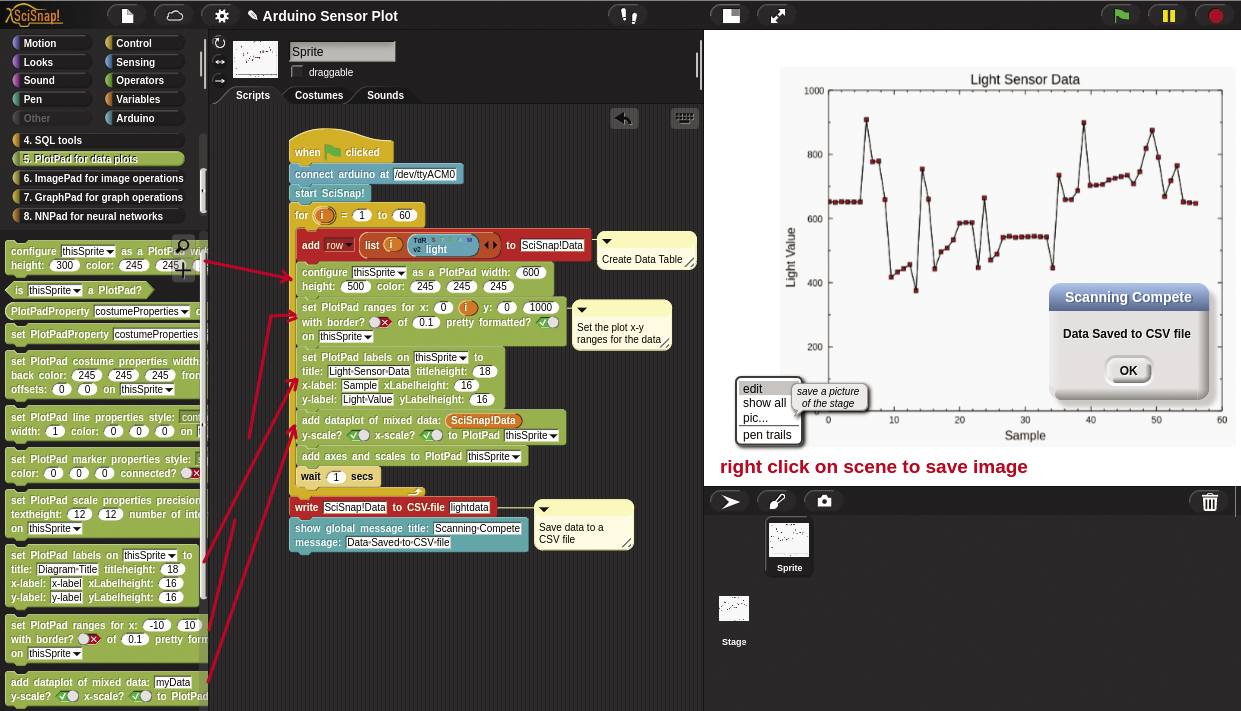
The data plot is created using the PlotPad for data plots grouping. The configure as a PlotPad block defines the chart size and positioning. The set PlotPad ranges sets the x-y scaling of the plot. (Note, the plot grows dynamically as new real-time data is added). The set PlotPad labels block defines the title and x-y labels. The add dataplot of mixed data block creates the line plot of evenly sampled data. Finally the add axes and scales to PlotPad shows the full labels and axes descriptions.
After the for loop completes, the sampled data is written to a CSV file (lightdata.csv), and a message box alerts the user that the script is complete. To save a copy of the data plot, right-click on the stage and select pic.
This project used a single data value, but it is also possible to use SciSnap! to handle multiple sensor values and do an x-y plot with linear regression.
Summary
Low-code programming techniques make it easy for inexperienced users to get started with programming, and Snap4Arduino takes care of the Arduino details, offering an ideal entry point for new users to quickly hook up and play with Arduino modules and simple sensors.
I found that, when I was moving between different Arduino modules and projects, I sometimes had to restart the Snap4Arduino application or web page. For users looking for more complex features, the SciSnap! library offers a wealth of functionality.