
Remeasured
Any application that collects a large number of measurements is bound to have some anomalous measurements, but good sensor breakouts should not output such values all the time. We tested eight temperature and humidity sensors for accuracy.
The data sheets of common temperature and humidity sensors tend to brag about accuracies in the range of a tenth of a degree. A closer look at 21 cases with eight different sensors shows which claims are true and which are just hot air from marketing.
It isn’t complicated to wire up a sensor and read the values cyclically. If you’ve ever done so, you’ve probably had the feeling at some point that the numbers didn’t add up. Deploying a second device only adds to the confusion, with deviations of up two units, which quickly gives rise to suspicions that your sensor lacks quality or was just too cheap, leaving you to wonder whether mysteriously high measured values are the result of a poor product or if the data sheets are incorrect.
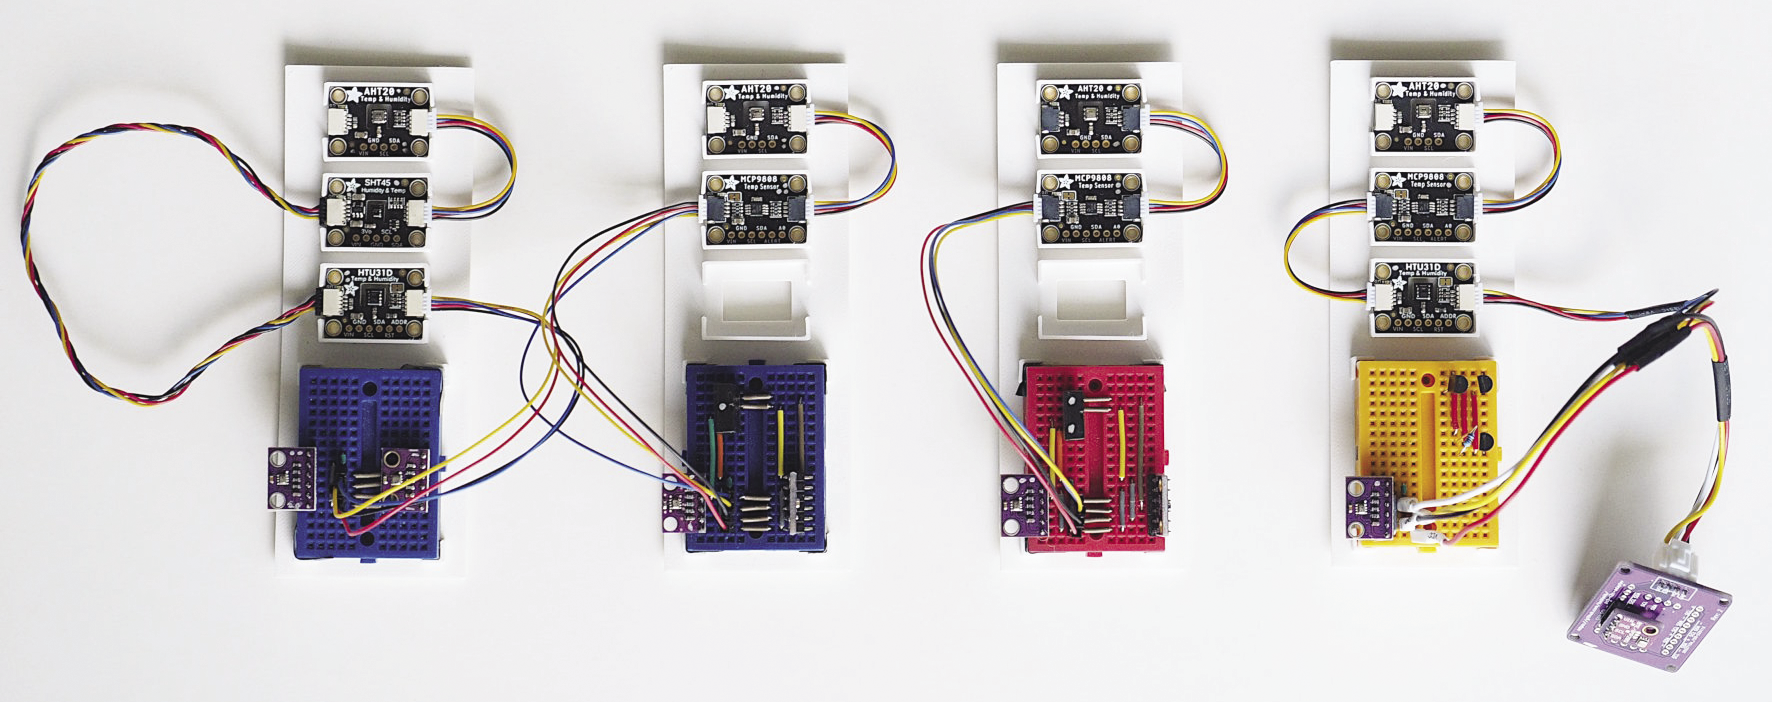
I looked into both lines of thought and try to offer some recommendations. Up to four examples of eight common sensor devices lined up to face the test (Figure 1). Most devices are from BerryBase or Pimoroni and some of them have been around for quite a while. Table 1 shows an overview of the features, technical values, and prices.
|
Sensor |
I2C Address |
Temperature (°C)a |
Humidity (%rH)a |
Pressure (hPa) |
Price |
Number |
|
BMP280 |
0x76/0x77 |
(-40) 0-65 (850)±1 |
– |
300-1,100±1 |
EUR1.60 ($2) |
4 |
|
BME280 |
0x76/0x77 |
(-40) 0-65 (85)±1 |
0-100±3 |
300-1,100±1 |
EUR5.60 ($4) |
4 |
|
AHT20 |
0x38 |
(-40) 0-60 (85)±0.3 |
(0) 10-80 (100)±2 |
– |
EUR5.25 ($5) |
4 |
|
MCP9808 |
0x18-0x20 |
-40 to 125±0.25) |
– |
– |
EUR5.90 ($5) |
3 |
|
AM2320 |
0xB8 |
-40 to 80±0.5 |
0-99.9±3 |
– |
EUR4.18 ($4) |
2 |
|
HTU31D |
0x40 |
(-40) 0-100 (125)±0.2 |
(0) 20-100±2 |
– |
EUR7.10 ($4) |
2 |
|
SHT45 |
0x44 |
(-40) 0-60 (120)±0.1 |
0-100/±1 |
– |
EUR14.90 ($13) |
1 |
|
DS18B20 |
– |
(-55) -10 to 85 (155)±0.5 |
– |
– |
EUR2.40 ($10) |
3 |
In addition to temperature, many of the sensors measure humidity, and the Bosch sensors can also measure air pressure. The BMP280 costs very little, which suggests that it is maybe a cheap clone. One exotic candidate on the list is the DS18B20: It does not have an I2C interface and does not come as a breakout, but as an integrated circuit (IC) in the TO-92 format used in semiconductor packages, mainly for transistors. The connection uses a single-wire protocol.
In the lab, I tried to obtain as many examples of each product as possible, but this effort was tricky because of cost and time constraints. That said, I always sent at least two examples into the fray, with the exception of the most expensive sensor, the SHT45. Additionally, the products do not cover all the application scenarios. If you want to build your own soldering oven, for example, you need a sensor with a completely different temperature range. At the bottom of the temperature scale, the selection’s range ends at -40°C at the latest.
Accuracy and Precision
The terms “accuracy” and “precision” appear in the data sheets – but not without a risk of confusion. Accuracy refers to the typical deviation from the true value. Precision is the amount by which repeat measurements of the same value vary. The values in the data sheets are difficult to compare because they typically use two expressions to define the “typical” and “maximum” accuracy.
The providers often give you additional graphics, but without additional information, these curves are incomplete and leave room for interpretation. Neither Figure 2 nor the HTU31D data sheet provide information on what percentage of all specimens fall within the “typical” or “maximum” curve.
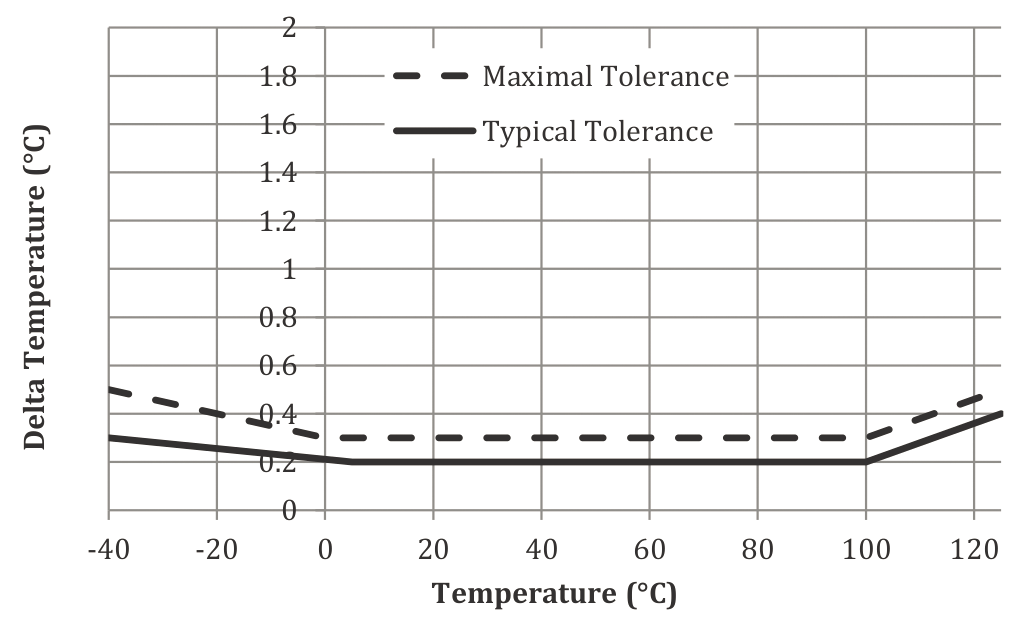
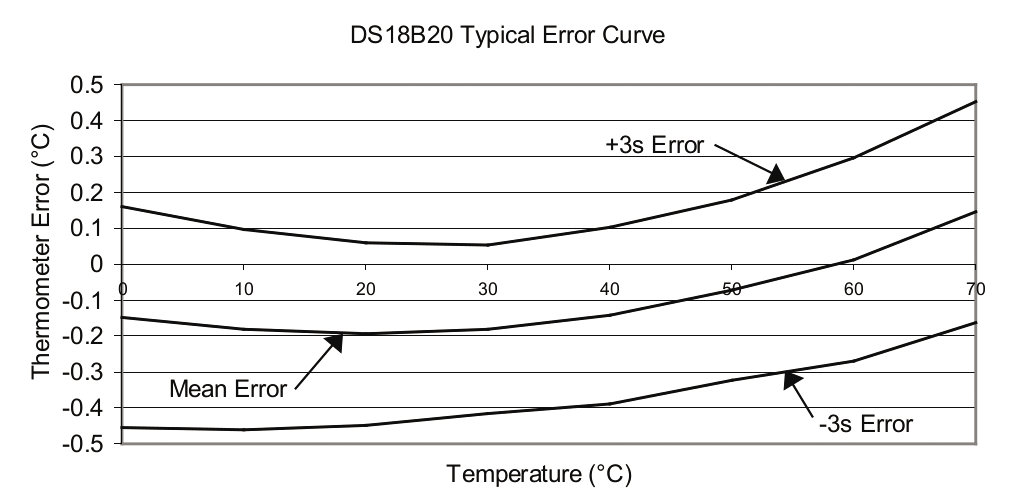
Figure 3 for the DS18B20, on the other hand, uses three-sigma values, and 99.73% of the sensors are within these limits. Many vendors use the two-sigma limit (95.45%), which makes the sensor look better, so adopting a three-sigma limit is exemplary. On the other hand, the DS18B20 curve lacks tolerance values for borderline cases.
Additionally, numerous factors influence accuracy, such as the type of quality control, dependence on the supply voltage, age of the sensors, structure of the board (including additional components), and soldering process. Sometimes you will find crucial information in footnotes. Bosch notes, for example, that the temperature readings of its sensors typically lie above the ambient temperature.
After studying numerous data sheets, you begin to realize that you need to treat the accuracy values as a guide rather than hard facts.
Measuring Setup
Theory aside, the sensors had to prove their value in various measurements. Assessing the absolute accuracy would have required a high-precision thermometer or a measuring chamber with precisely adjustable temperature and humidity. With neither available, my test is by no means a scientific investigation. You have to evaluate the measured values compared with the average of all sensors. The theory behind this process is known as “crowdsensing,” which basically means that the average of many independent measurements is more accurate than any single measurement.
I distributed the 21 sensors in the test across four I2C buses and one, one-wire bus. Two Pi Picos with their two I2C buses each acted as data collectors. Controlled by a real-time clock (RTC), data acquisition took place almost simultaneously. The data ended up on microSD cards and were later merged. A data logger provided the necessary tools. However, I had to create the readout routines for some sensors, which was quickly done thanks to online examples. Pandas was used for the computations and Matplotlib for the display.
The measurements took place indoors, away from heat sources or drafts. Additionally, I put the sensors in the refrigerator and in the oven. These phases can be clearly identified in the evaluation. As a side note: The oven was set to its lowest temperature of 50°C (122°F). However, as the graphs show, the oven thermostat turned off the heat too late, which caused some damage to the sensor brackets.
Results
The data and comparison graphs with the results could fill many pages. This article is therefore limited to a few interesting insights. The details can be found in the associated GitHub project.
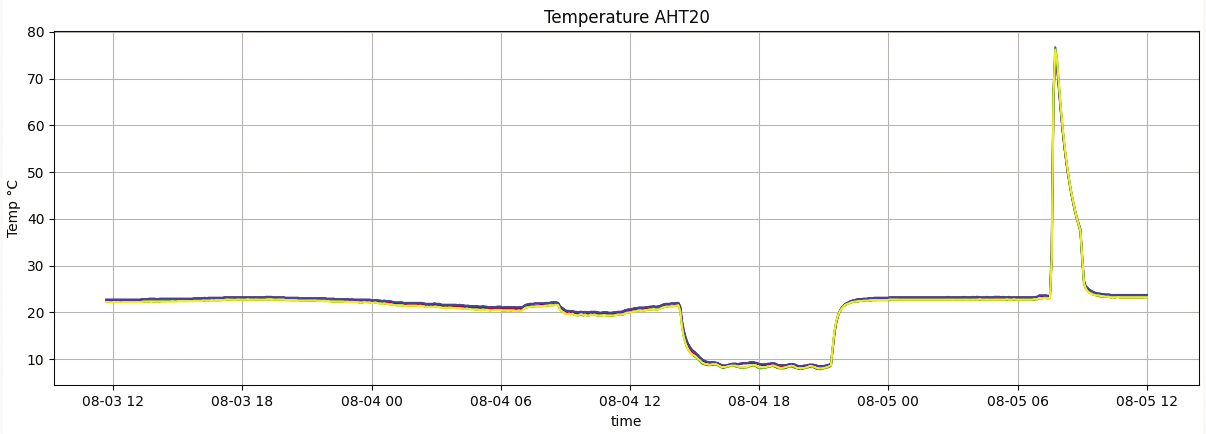
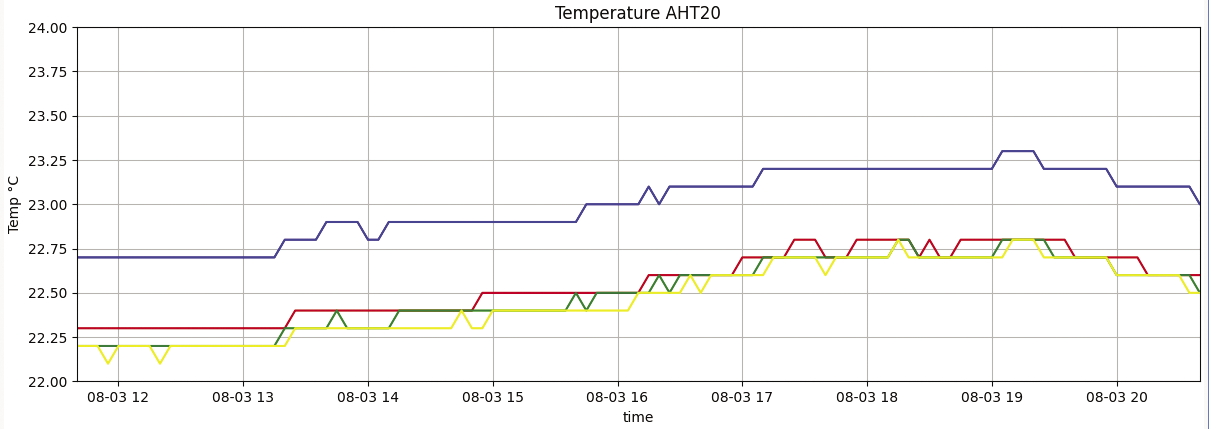
In two words, the results can be described as “positively boring,” which means the sensors in the measurement range of the test fulfill the promises made by their data sheets. If you look at the entire measurement period, it is difficult to identify the individual test specimens (Figure 4, AHT20). Zooming in makes individual gradients recognizable. Figure 5 shows that the measurement results of the four AHT20 sensors are within 0.5°C (0.9°F). The data sheet promises ~0.3°C (0.5°F), so that is OK.
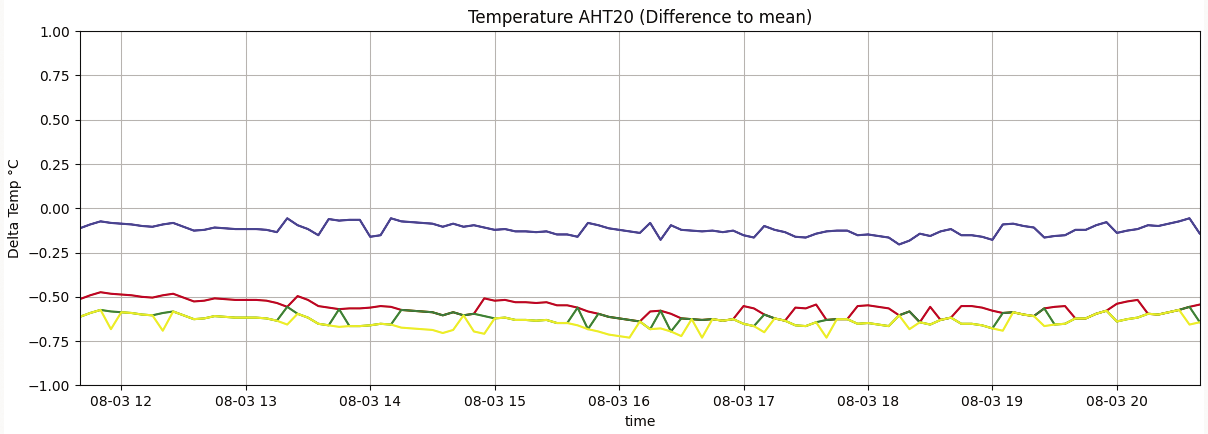
A comparison of the mean values for all sensors proves to be interesting. In Figure 6, you can see that the AHT20 test specimens tended to underestimate the temperature. It would be unreliable to draw a general conclusion from these results because only four sensors were in the test.
When looking at the deviation from the mean, the most expensive sensor (SHT45) performed best, but the inexpensive DS18B20 also achieved similar precision values. Differences in humidity were somewhat greater, but even the poorest performers were no more than six percentage points off the average. Only the Bosch sensors measure the air pressure, and they do it very well, typically deviating from the official air pressure by only 1-2 hectopascals (hPa).
Recommendations and Conclusions
Your choice of sensor must be based on the measuring range and the required accuracy. The price is less important for home use. Going for an expensive model probably has less effect on the measurement results than the way you operate the sensor. If you want a second opinion, deploying a few of the affordable DS18B20 models is a good idea.
Be sure to isolate sensors from sources of interference. A sensor on a Pi HAT will always return incorrect data. Even a sensor connected to the Raspberry Pi by cable will be exposed to too much waste heat in the long run. The single-board computer is not a good basis for measurements, even if many suppliers offer complete solutions for this purpose.
Ideally, you would want the measuring computer to switch off between measuring intervals. If this is not an option, it is best at least to switch the sensor to sleep mode because many sensors lose accuracy if they are forced to run constantly in measurement mode. A closer look at the data sheets will help you in this regard. If in doubt, check the driver, because it sometimes sets a few well-meant settings during initialization that are less than perfect for the intended use case.
Operated correctly, all of the sensors tested are good for measuring temperature, humidity, and air pressure. The SHT45 is the measurement king of the hill, with the BME280 winning the prize for the best all-rounder (with some sacrifices in terms of accuracy). The DS18B20 offers the best price-performance ratio. If you use the BMx280, it is essential that you check the initialization in the driver. Arduino sets a good example with a number of selectable presets that follow the recommendations of the data sheet.
More informative results will be provided by a second measurement campaign planned for the winter with its far lower temperatures. You will find the results in the GitHub project.