NiceGUI Lets You Create Web Apps in Python
With a Raspberry Pi and the NiceGUI Python library you can build a weather station or a Pi Rover app in less than 15 lines of Python code.
The Python ecosystem is incredibly large, so it will not be unexpected that there are some excellent Python libraries that help you create web apps. Packages like Remi and PySimpleGUIWeb are great tools for building web apps totally in Python, and for web charting there are some solid choices like Bokeh and Plotly.
If you’re looking for an integrated Python web solution that handles both charting and displaying widgets, you might want to consider NiceGUI: It lets you do everything in Python (no JavaScript or HTML required), it offers charting, chatting, data input, layout, and multi-media components, and the web server is built-in, too.
In this article, I introduce NiceGUI with two classic Raspberry Pi web projects: a Pi-based rover and a basic weather station. Both projects will include live video, and the Python scripts will contain less than 15 lines of code.
Getting Started
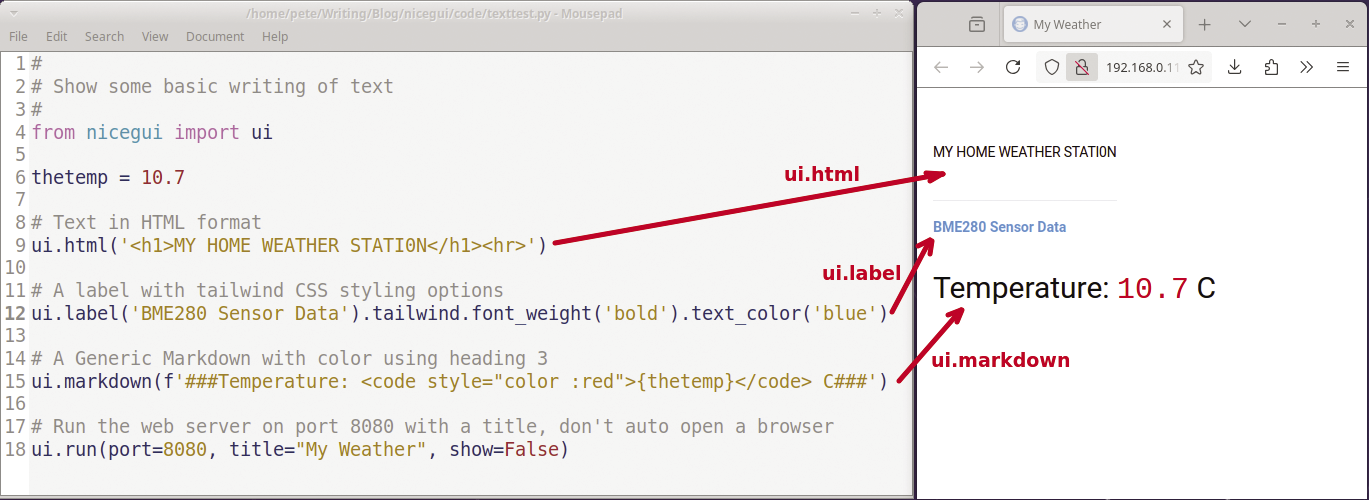
To install the NiceGUI library on a Raspberry Pi, run pip3 install nicegui. As a first example, I’ll create a simple web page with text elements. NiceGUI gives you several options for showing text. Figure 1 presents three of the more common text options:
- Line 9 uses the
ui.htmlmethod. This approach is useful if you want to cut-and-paste some existing HTML text. - In line 12, you can see the
ui.labelmethod. The example sets two Tailwind CSS style properties to make the text bold and colored. - The third approach (line 15) uses the
ui.markdownmethod. The Markdown syntax can adjust the type of text along with bold, italics, sizing, and underlining properties. For this example,###sets a heading size of3. Colored text is not natively supported in the Markdown syntax. However by embedding HTML code with a style property, it’s possible to create colored text within Markdown code.

The final step in the script is to call NiceGUI’s web server framework (line 18). The ui.run() statement has quite a few options. In this example, I ask the web application to run on port 8080 (the default port for NiceGUI), set a title, and don’t automatically launch a web browser (show=False).
Read Input
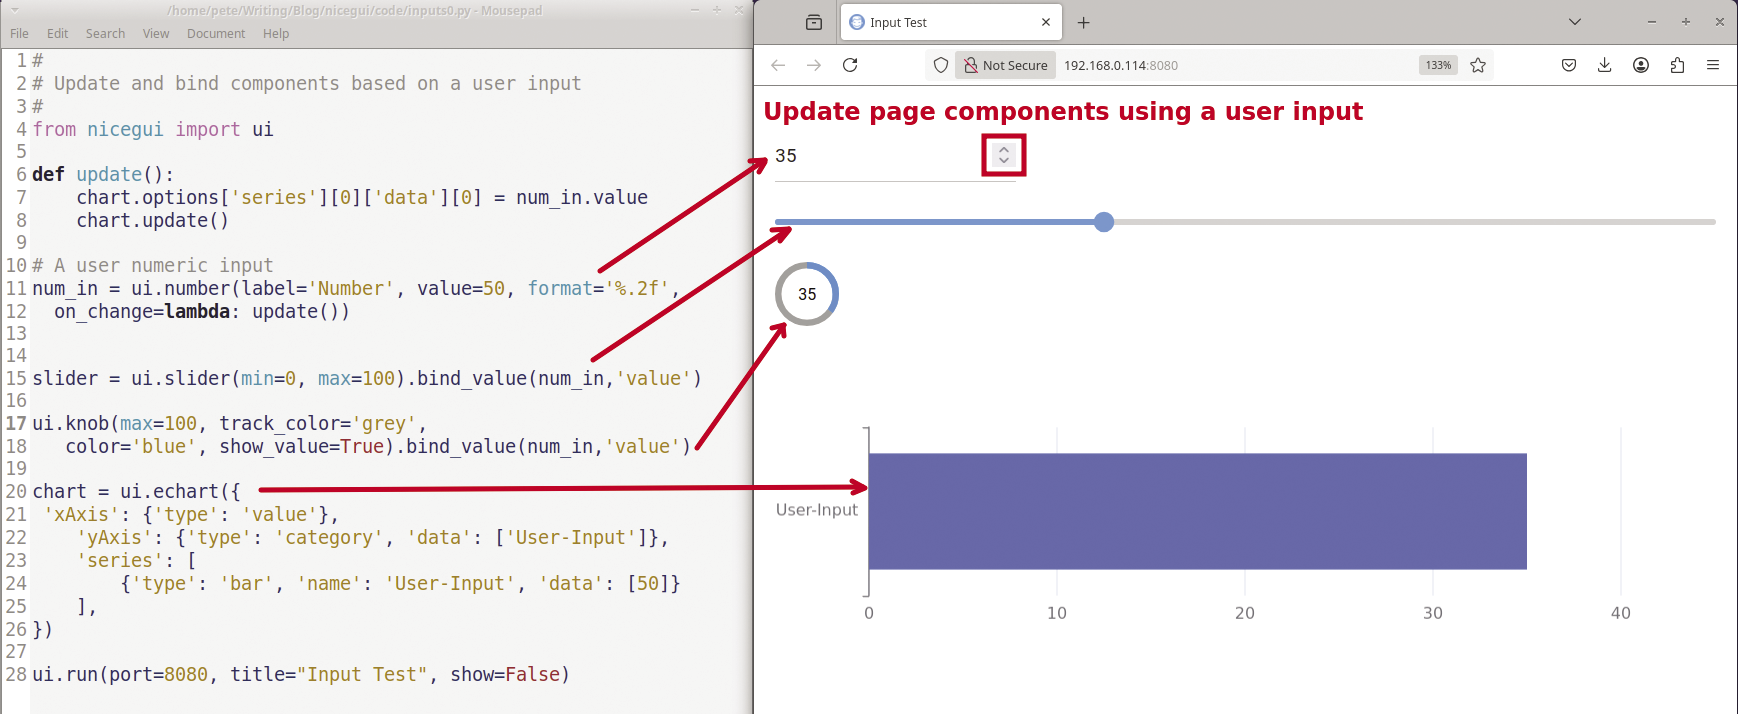
NiceGUI also provides a variety of user input widgets. Interaction between web user input items and the Python script is handled via event actions and/or bind properties. Figure 2 shows an example that uses both methods. The web application adds a numeric user input (ui.number) to the top of the screen (lines 11-12). The number can be adjusted by manually entering a new value or by toggling the up/down spinner. This element is also configured with an on_change event which calls an update() function.

Below the number input, the script adds a slider (line 15) and a knob (line 17). Both widgets have a bind configured between their values and the number input’s value using the bind_value(object, 'value') method.
Lines 20-26 add an ui.echart component at the page bottom that can create several charting presentations. For this page, I’ve defined a single horizontal bar (line 24). The update function refreshes the bar’s value; it is called by the on_change event of the input number element. Modifying a value in a chart series is a little more complicated than changing a slider or a knob value – for example, you can set the first (0th) series and the first (0th) item in the chart series to a new value and then update the chart via
chart.options['series'][0]['data'][0] = num_in.value
chart.update()
Add a Video Stream
I will later want to stream video from a USB webcam for both the weather station and the Pi rover projects. There are a number of video solutions; for the two projects, I have used the lightweight mjpg-streamer tool that can be installed using Snap:
sudo apt install snapd
sudo snap install mjpg-streamer
(The first command is only necessary if you haven’t previously installed Snap.) Once the video streaming software is loaded, it can run in the background on port 8081. The following command launches mjpg-streamer in background daemon mode:
mjpg-streamer -b -i "input_uvc.so" -o "output_http.so -p 8081"
You can then create a simple NiceGUI-based USB streaming video page with the ui.image() method:
from nicegui import ui
ui.image('http://ip_address:8081/?action=stream')
ui.run()
This basic example uses the earlier 8081 port definition with the parameter action=stream to show real-time video on the web page. To get a single static image instead, use action=snapshot.
Weather Station Example
The hardware for my weather station project includes a BME280 sensor ($5-$20), but other components such as low-cost DHT22 temperature sensors ($2-$10) would work as well. I purchased a newer webcam model and found that it had excellent video quality. However, during my first attempts on the project, I used older, lower quality webcams, and those had some issues with white balance. I was able to work through these issues, but the overall picture quality was poor.
I mounted my Pi on a protected railing where I wasn’t concerned about moisture. For a more weatherproof setup, I would recommend that you put the Raspberry Pi and BME280 sensor in a tight plastic enclosure and then mount a second Pi and a webcam inside looking out a window. The outside Pi could run the full NiceGUI Python code and then reference the second Pi’s IP address for the video stream.
The only additional software that is required is the Python BME280 sensor library that you can install with pip install bme280pi. Listing 1 shows the full code needed to display the outside temperature and a live video feed. For readability, the gauge configuration was spread across multiple lines, but only 12 actual lines of code were needed for this application. The video is automatically refreshed by the mjpg-streamer daemon, and the temperature is updated every 15 seconds using a NiceGUI timer.
Listing 1: Weather Station Project
01 #!/bin/python3
02 #
03 # gauge1.py ‑ write BME280 sensor data to a gauge
04 #
05 from bme280pi import Sensor
06 from nicegui import ui
07
08 # Define the BME280 devince with its IC2 address
09 sensor = Sensor(address=0x76)
10
11 with ui.header().style('background‑color: #3874c8'):
12         ui.markdown('### My Weather')
13
14 v = ui.image('http://192.168.0.105:8081/?action=stream')
15
16 tempchart = ui.echart({
17  'title': {
18     'text': 'Outside Temperature',
19     'left': 'center',},
20     'series': [
21         {'type': 'gauge', 'min':‑20, 'max':40 ,
22          'startAngle': 180, 'endAngle': 0,
23          'data': [round(sensor.get_temperature(),1)] }],
24      'detail': { 'formatter': '{value} C' }
25
26     } )
27
28 # Create a refresh function that updates the temperature
29 def update():
30     tempchart.options['series'][0]['data'][0] = round(sensor.get_temperature(),1)
31     tempchart.update()
32
33 # use the nicegui timer to periodically refresh the data
34 ui.timer(15, update)
35
36 # Run the web framework on the default port 8080
37 ui.run(title='My Weather Station', show=False)
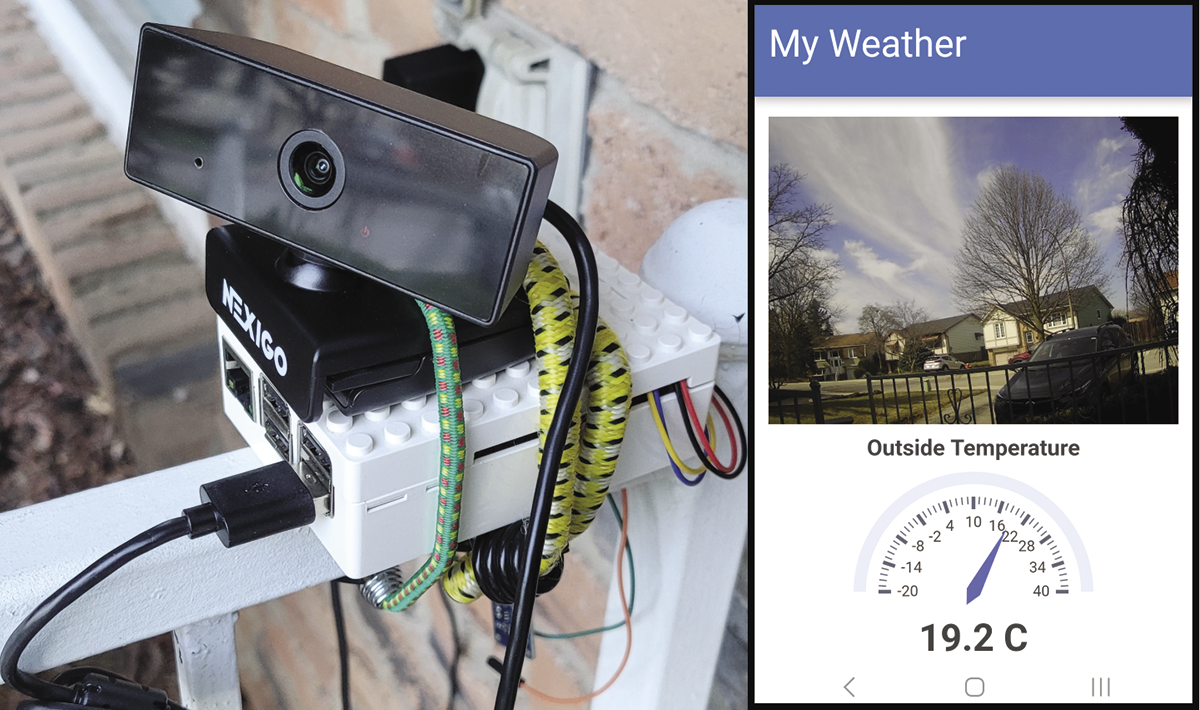
The header (lines 11-12) uses a blue (#3874c8) background with a Markdown level three heading. In line 14, ui.image loads the video stream from the Raspberry Pi’s IP address. The chart type is defined as a gauge with a range of -20 to 40 (line 21). I’ve set the initial bar value in line 23, and then I refresh it every 15 seconds with the update() function (lines 29-31). Finally, the script activates the NiceGUI web framework with a title of “My Weather Station” using the default port 8080 (line 37). Figure 3 shows the Raspberry Pi weather station setup and what the resulting web page looks like in the browser.

A Pi Rover Example
For the second project, you will need a Raspberry Pi, a Pi motor shield, a portable USB battery, a USB webcam, and some jumpers and straps. I’ve used a Pimoroni Explorer Hat Pro shield, but any motor or relay shield should be fine. It’s important that you don’t attempt to connect the motors directly to the Raspberry Pi pins, because the Pi hardware is not designed to handle large power surges.
Your specific motor shield will probably have some custom software. With my hardware setup, I needed the Pimoroni Python library that can be installed with:
curl https://get.pimoroni.com/explorerhat | bashListing 2 shows all it takes to create a web interface that controls the Pi rover and includes a real-time video stream for remote driving. I’ve implemented this project numerous times using Bash CGI, Node-RED, PHP, and several different Python libraries, and I believe that NiceGUI offers one the cleanest and lightest solutions with only 14 lines of code.
Listing 2: Pi Rover Project
01 #!/usr/bin/python3
02 # rovergui.py ‑ Use nicegui to create a web control for a rover
03 #
04 from nicegui import ui
05 import explorerhat
06
07 # Create a heading using markdown syntax
08 ui.markdown('#**Rover Controls**#')
09
10 # Define the two motor objects
11 def motors(speed1, speed2):
12     explorerhat.motor.one.speed(speed1)
13     explorerhat.motor.two.speed(speed2)
14
15 # Create 3 rows of buttons
16 ui.button('Forward', color='green',on_click= lambda: (motors(100,100)) ).style('width: 65%')
17 with ui.button_group().props('push glossy'):
18     ui.button('Left',  color='cyan', on_click=lambda: (motors(0,100)) )
19     ui.button('Stop',  color='red',  on_click=lambda: (motors(0,0)) )
20     ui.button('Right', color='cyan', on_click=lambda: (motors(100,0)) )
21 ui.button('Back', color='orange', on_click=lambda: (motors(‑100,‑100)) ).style('width: 65%')
22
23 # Add a motion video feed
24 v = ui.image('http://192.168.0.105:8081/?action=stream')
25
26 ui.run(port=2020, show=False)
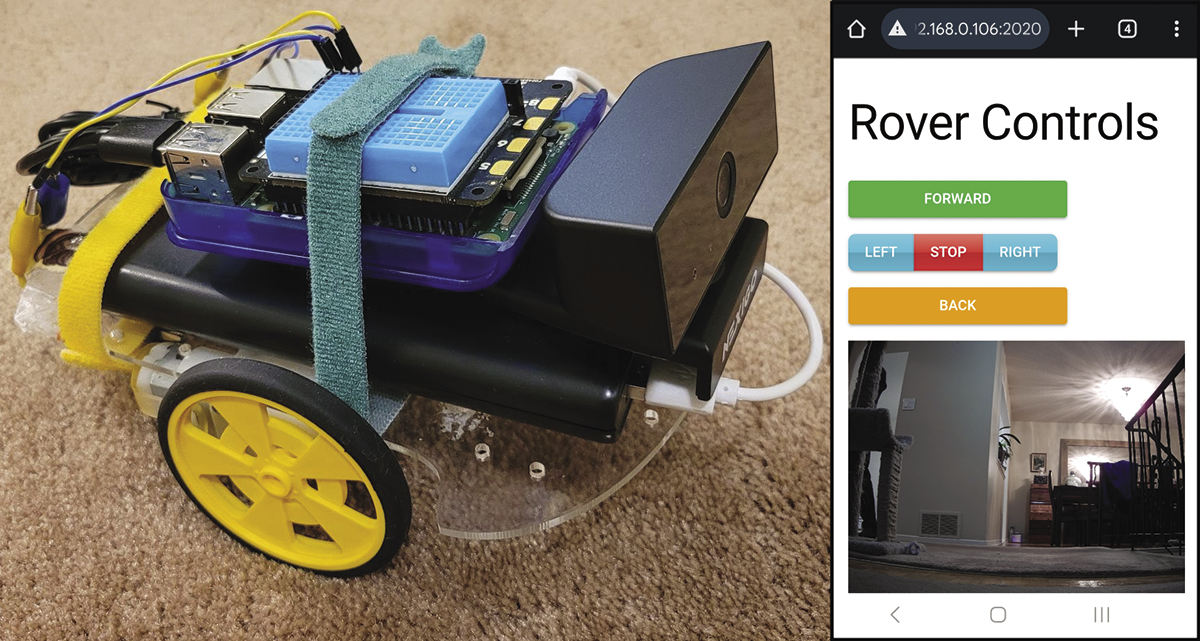
The script uses ui.button to create colored push buttons that control the rover’s direction (lines 16-21). A button_group (line 17) arranges the LEFT, STOP, and RIGHT buttons on one line. All of the buttons call the motors() function that sets the first and second motor speeds (lines 11-13). Figure 4 shows the Pi rover and the NiceGUI-based interface.

Summary
If you’re looking for a simple all-in-one tool, then NiceGUI is a great solution. It lets you create an entire application in Python without any HTML, JavaScript, or specialized forms code. NiceGUI also includes a full set of web components, so you don’t need to load any third-party charting or user interface libraries.
NiceGUI is an excellent fit for small Raspberry Pi projects. I found that it has a short learning curve, and I was up and running very quickly. However, if you’re after some customized web presentations, you’ll need to do some digging into the Tailwind CSS documentation.


